Hey there, fellow website owner, marketer, or just interested internet explorer! 👋👀
Let's be real for a moment—no one likes a slow website. You click on a link, wait what feels like forever (even though it's just 3 seconds), and BAM—you bounce. Off to the next competitor. Poof. Just like that.
If you run a website—whether it is a personal blog, a business website, an online shop, or even a portfolio—you should know how your website does. Not "looks good" or "seems fine," but how it's really doing in terms of speed, load time, uptime, responsiveness, and so on.
And boom. You don't need to guess. There are some amazing tools that will do all the heavy lifting for you.
Today, we're going to go through the Top 5 web performance monitoring tools, what makes them all so awesome, and how you can use them to have your site running smoothly.
📊 Why Website Performance Matters (Let's Break It Down)
Before we get into the tools, let me get one thing straight—why should you care about web performance?
- User Experience: If your site takes more than 3 seconds to load, you're losing visitors.
- SEO Rankings: Google adores speedy sites. Page speed is a ranking factor.
- Conversions: Better performance = greater trust = more sales, signups, or leads.
- Mobile Friendliness: On mobile, performance is even more critical with less data and slower networks.
- First Impressions: Your site might be a first impression of your business. Make it count!
So yeah—monitoring your website performance isn't optional. It's required.
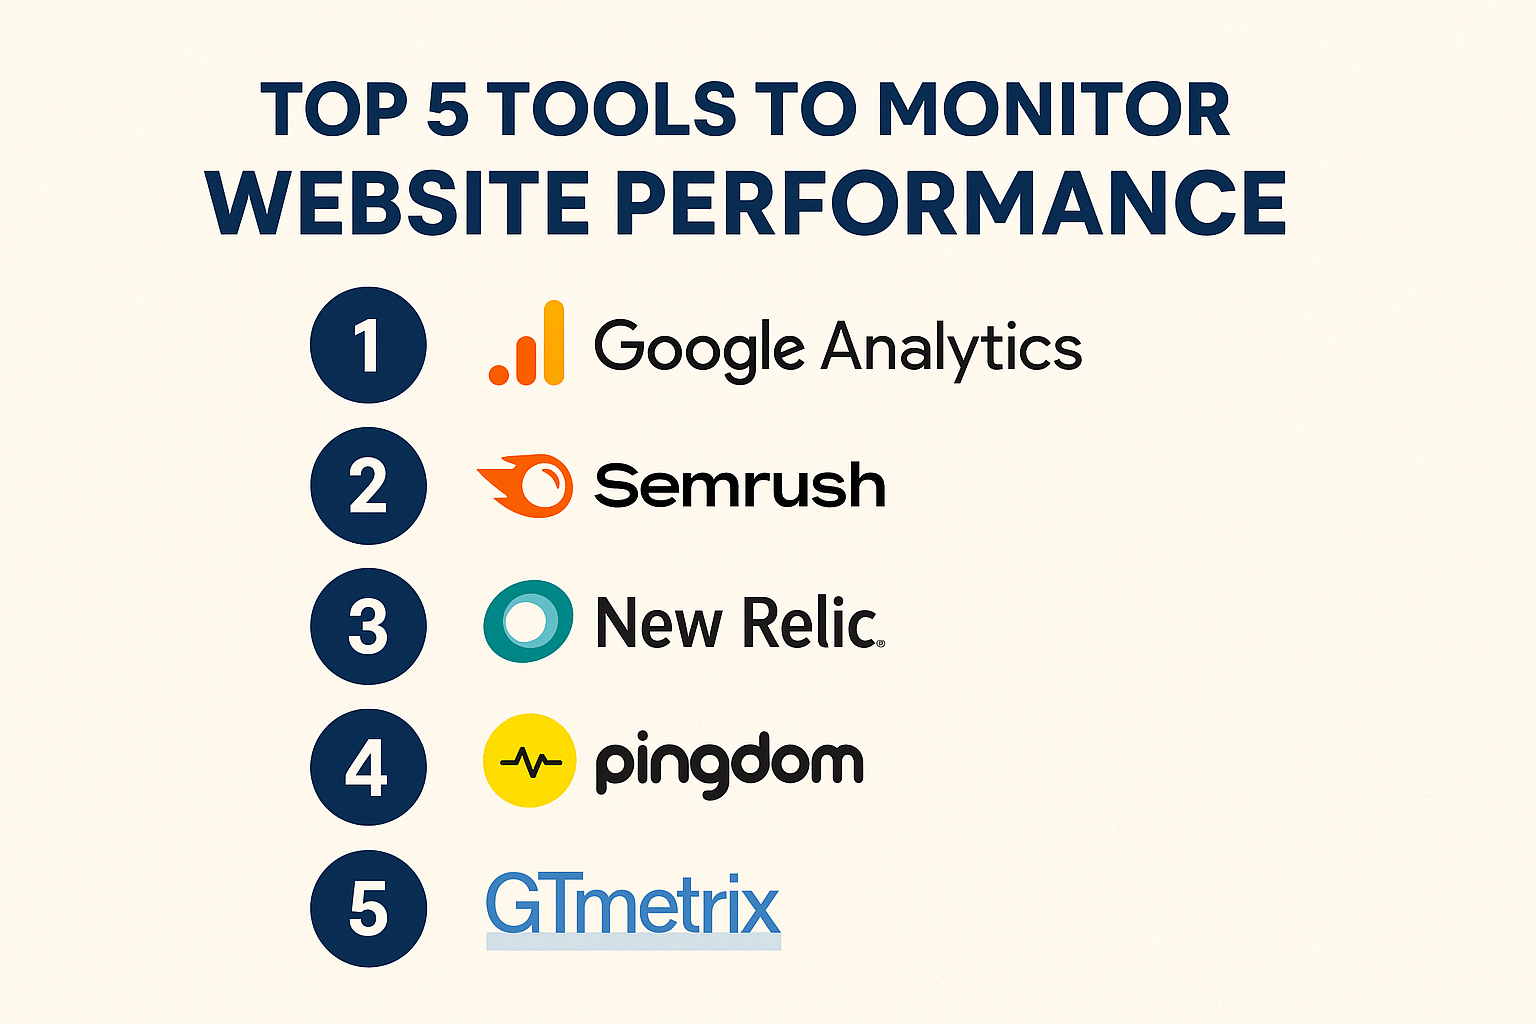
🛠️ Top 5 Tools to Monitor Website Performance
Alright, let's get to the good stuff.
1. Google PageSpeed Insights (PSI)
Website: https://pagespeed.web.dev
Best For: Checking how your site performs on mobile and desktop, and getting accurate improvement suggestions.
Why It's Awesome:
Google PageSpeed Insights is as good as getting advice from the bosses themselves. They inform you exactly how Google views your site's speed and performance. You enter a URL, and within seconds, you have a performance score out of 100—both mobile and desktop.
You will also receive detailed insights on:
- Core Web Vitals (like LCP, FID, CLS)
- How to make it faster
- Chances for removing unused code or compressing images
Bonus Tip: Combine PSI with Google Search Console for broad insights.
2. GTmetrix
Website: https://gtmetrix.com
Best For: In-depth analysis and speed optimization reports.
Why It's Awesome:
GTmetrix is perhaps developers' and marketers' favorite tool. It deconstructs everything that's slowing your site down—from image size to JavaScript render-blocking.
Key features are:
- Performance and structure grades
- Waterfall charts (to examine how each component loads)
- Historical tracking (with a free account)
- Ability to test from multiple locations
Pro Tip: Test from locations where your core audience is. Speed is regional!
3. Pingdom Website Speed Test
Website: https://tools.pingdom.com
Best For: Basic performance reports and uptime monitoring.
Why It's Awesome:
Pingdom is laughably simple for newbies to use. Just enter your URL and choose a location. It gives you a performance score, time to load, page size, and request numbers.
What I particularly enjoy in Pingdom:
- Really basic reports
- Great for the clients or non-techie end
- Also includes uptime monitoring (nice to know when your site goes down)
Use Case: Monitor speed and reliability frequently—if you have an eCommerce or service-based site
4. WebPageTest
Website: https://www.webpagetest.org
Best For: Advanced users who want a deep dive into performance metrics
Why It's Awesome:
If you are a developer, performance geek, or enjoy the techie things—WebPageTest is for you. It offers detailed testing options like:
- Multi-step transactions
- Testing across multiple devices and browsers
- Video recording of the load experience
- Time to First Byte (TTFB), Start Render, and others
Heads Up: The interface is not as flashy as GTmetrix or Pingdom, but it's robust.
5. New Relic
Website: https://newrelic.com
Best For: Real-time performance and monitoring insights for websites and apps.
Why It's Awesome:
New Relic is a monster. It's more than page load and speed—it's a full-stack monitor. You can track frontend, backend, server performance, infrastructure, APIs, and so much more.
Some deadly features:
- Real user monitoring (RUM)
- Synthetic monitoring
- Error tracking
- Application performance metrics
Best Suited For: Teams working on large websites, apps, or SaaS platforms.
Note: It does have a learning curve, but once you become familiar with it, you won't look back.
🤔 So, Which One Should You Use?
Seriously? You don't have to pick one.
Here's a cheat sheet:
- Beginners / Solopreneurs – Get started with Google PageSpeed Insights and Pingdom
- Developers / Techies – Throw in WebPageTest and GTmetrix
- Growing Teams / SaaS Sites – Take some time to get familiar with New Relic
With 2-3 tools in combination you get a far more comprehensive view.
🚀 Bonus Tips to Improve Performance (Once You've Optimized It)
Knowing your performance is step one. Improving it is the goal. Here are some quick tips:
- Use lazy loading for images
- Optimize image sizes (JPG, WebP over PNGs)
- Minify CSS and JavaScript
- Use a CDN like Cloudflare
- Choose a fast hosting provider
- Remove unnecessary plugins or scripts
✅ Final Thoughts
Monitoring your website’s performance isn't just about numbers—it’s about providing the best possible experience for your users, ranking better on search engines, and turning clicks into customers.
These tools are simple, even if you're not a programmer. They are all free to try so there's really no reason not to begin today.
Go ahead, choose a tool, enter your URL, and see how you fare. You might be amazed. And from there—you can only go up! 🚀

